
I have recently discovered that creating your own category order on a Pandas DataFrame column could be a very powerful tool. It certainly saved me some headaches. There are of course tricks one can use in order to avoid this, e.g. creating a new column with explicit order (say a numerical value or a char), then using it when sorting. However, as a general rule, I find that writing down and if need be implementing a specific order for every column in a DataFrame is the way to go. For numbers, the default order is usually good, but not always. For strings, the situation is even worse, as an alphabetical order could be completely uncorrelated with the data. In fact, the data itself may, in some form or another, already reflect a very certain order. If the order does not seem important, it could still have repercussions on your plotting abilities (which I will address in later posts).
Let’s start by loading up some data using one of my favorite packages, Seaborn.
1
2
3
4
5
import seaborn as sns
import pandas as pd
from pandas.api.types import CategoricalDtype

tips = sns.load_dataset("tips")
This actually came to me while working on bar plots, so let’s plot some bars!
1
barplot = sns.barplot(x="day", y="total_bill", hue="sex", data=tips)
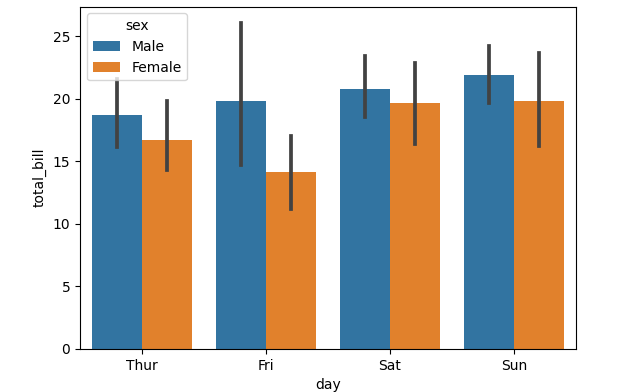
Why are the days automatically ordered this way? Let’s have a quick look.
1
tips["day"]
Outputs:
1
2
3
4
5
6
7
8
9
10
11
12
13
0       Sun
1       Sun
2       Sun
3       Sun
4       Sun
       ...
239     Sat
240     Sat
241     Sat
242     Sat
243    Thur
Name: day, Length: 244, dtype: category
Categories (4, object): ['Thur', 'Fri', 'Sat', 'Sun']
The data is categorical, for which we can easily change the order! How you ask?
Meet CategoricalDtype
Assume we want to change the order so that Sunday is actually the first day from the left. All we need to do is define a new custom order, and apply it to the appropriate DataFrame column:
1
2
3
4
MY_ORDER = ['Sun', 'Thur', 'Fri', 'Sat']
MY_CAT_ORDER = CategoricalDtype(MY_ORDER, ordered=True)

tips["day"] = tips["day"].astype(MY_CAT_ORDER)
And now if we replot, we get the following:
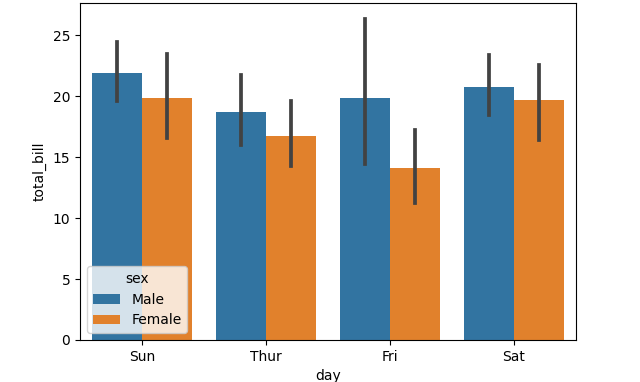
Simple, isn’t it?
Some more food for thought
Let’s plot the data and use the party size (the aptly named “size” column) as our categories:
1
barplot = sns.barplot(x="size", y="total_bill", hue="sex", data=tips)
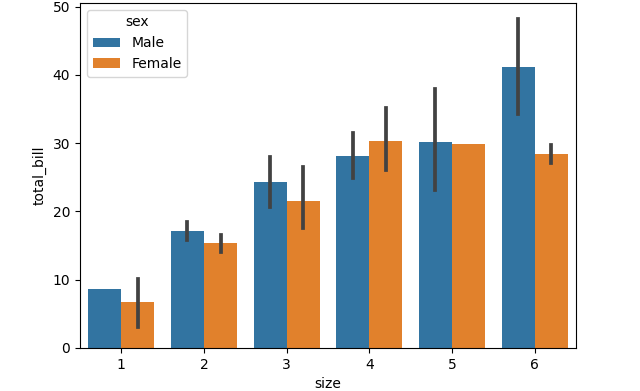
Here the data is in int, so the order is the natural order of int. What if we want to change the order to [1,3,6,2,4,6]? We could define that column to so it’d be a categorical column with the order we want, as we did above. But do we need to? In this case, not really, if we use Seaborn correctly:
1
barplot = sns.barplot(x="size", y="total_bill", hue="sex", data=tips, order=[1,3,6,2,4,6])
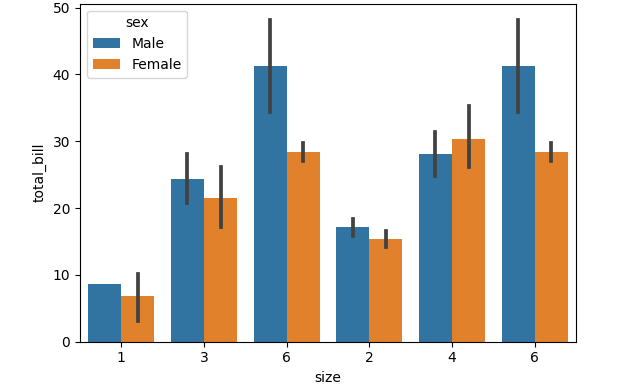
Using the order option of barplot, we can achieve the same result.
Do we really need CategoricalDtype then?
Yes! But, as with everything, it depends on your usage. I’ll write about this some other time, but the way matplotlib organizes the bars in the actual plot is… interesting. Not having the data ordered before calling the plotting function could have consequences on the amount of control you’ll have later on, if you want to customize labels, hatches, etc., which is why I still find this feature useful.
TL;DR:
- Make sure you know the desired order for each DataFrame column.
- If the default order does not match the desired one, implement using CategoricalDtype!